However, although widely used, it can sometimes be confusing, particularly because of its limitations. In this article we will see the definition of the p-value, its use, and provide concrete examples to better understand its importance and implications in statistical analyses.
I - Definition of P-value
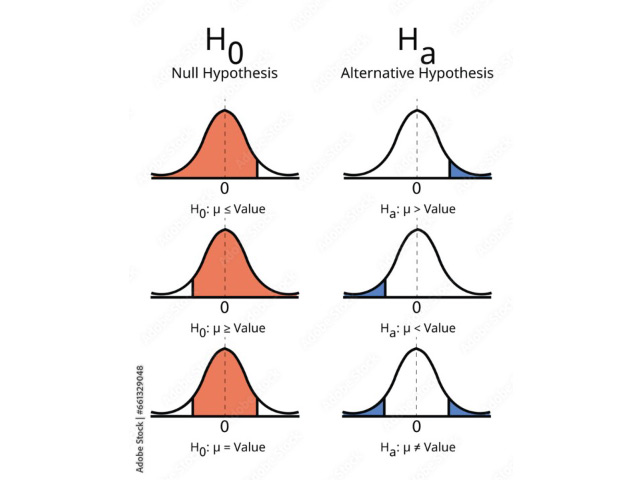
The P-value is a probability that quantifies the degree of surprise of the observed data, under the null hypothesis (H0). More precisely, it represents the probability of obtaining a result at least as extreme as the one observed, assuming that the null hypothesis is true.The null hypothesis (H0) is often a statement of "no effect" or "no difference". For example, in a clinical trial, the null hypothesis might be: "The new medicine has no effect compared to placebo."
A low P-value (usually below a predefined threshold, often 0.05) indicates that the observed results are unlikely to be due to chance under the null hypothesis, and this often leads to rejecting this hypothesis. Conversely, a high P-value suggests that the results may well be due to chance, and that the null hypothesis should not be rejected.
· ON THE CONCEPT OF P -VALUE
· p-value definition and meaning
· P Values
II - How to calculate the P-value?
P-values are usually automatically calculated by statistical software such as R, SPSS, etc.You can also find tables online for estimating the P-value of your test statistic.
These tables show, based on the test statistic and the degrees of freedom (the number of observations minus the number of independent variables in your test), how often you would expect to obtain that test statistic under the null hypothesis.
The calculation of the P-value depends on the statistical test you are using to test your hypothesis:
Different statistical tests have different assumptions and produce different test statistics. You should choose the statistical test that best fits your data and the effect or relationship you want to test.
The number of independent variables included in your test influences the size of the test statistic needed to obtain an identical P-value.
III - Interpreting a P-value
If :Low P-value (< 0.05): The results are unlikely to be due to chance. This means that there is probably a real effect, and so the null hypothesis is rejected. The results can be said to be statistically significant.
High P-value (> 0.05): The results may be due to chance, so there is not enough evidence to reject the null hypothesis. The results are not considered significant.
However, it is important to note that the P-value does not directly measure the probability that the null hypothesis is true or false, nor the size or importance of the observed effect. It simply quantifies the compatibility of the data with the null hypothesis.
· The use of p-values in applied research: Interpretation and new trends
· The p value – definition and interpretation of p-values in statistics
· P Value: Definition, Formula, Table, Calculator, Significance
IV- Examples :
1. Clinical trial of a new medication
Let's imagine that a pharmaceutical company is testing a new pain medication. The null hypothesis (H0) would be that the drug has no effect, that is, it does not reduce pain more than a placebo.After analyzing the data from the clinical trial, the researchers calculate a P-value of 0.03. Since this value is less than the threshold of 0.05, they can reject the null hypothesis and conclude that it is unlikely that the observed effect is due to chance. The medicine therefore appears to be effective.
2. Study on average salaries for men and women
Suppose a study is being conducted to determine whether there is a statistically significant difference between the average salaries of men and women in a company. The null hypothesis (H0) would be that there is no difference in average salaries between the two groups.The results show a P-value of 0.08. This value is greater than 0.05, which means that there is not enough evidence to reject the null hypothesis.
In other words, the observed differences between the salaries of men and women could be due to chance, and the study concludes that there is no significant difference between the two groups.
3. Analysis of product sales
A marketing company wants to know if a new advertising campaign has a significant effect on sales. The null hypothesis would be that the campaign has no effect, that is, that sales do not change.After analyzing the sales data before and after the campaign, they find a P-value of 0.001. This extremely low P-value suggests that it is very unlikely that the increase in sales is due to chance. They therefore reject the null hypothesis and conclude that the advertising campaign has a positive effect on sales.
· P-value: Definition, formula, interpretation, and use with examples
· P Value Formula
· Lesson p values
V - Conclusion
The P-value is a powerful tool for researchers when it comes to testing hypotheses and determining whether observed results are significant.However, it should not be used alone to draw conclusions. It is important to combine it with other statistical methods and interpret the results in the context of the study.
P-values provide insight into the reliability of the results obtained, but they should be taken with caution, taking into account the inherent limitations of this statistical tool.


